Lodz|Poland
Statistical Data
Google entries for Lodz, Łódź 124.900.000
Google entries per inhabitant 172,25
First mentioned in a document 1332
http://de.wikipedia.org/wiki/%C5%81%C3%B3d%C5%BA#Geschichte
Surface area 293 km²
Population density 2.464 inh. / km²
http://de.wikipedia.org/wiki/%C5%81%C3%B3d%C5%BA
POPULATION
Inhabitants (2011) 725.100
http://www.stat.gov.pl/cps/rde/xbcr/lodz/ASSETS_12m_LODZ_NA_TLE_DUZYCH_MIAST.pdf
Age groups in % (2011)
0-18 14,9%
19-44 36,46%
45-64 30,79%
>65 17,95
http://www.stat.gov.pl/cps/rde/xbcr/lodz/ASSETS_12m_POPULATION.pdf
Gender ratio (2011)
total 725100
Women 395200
Men 329900
http://www.stat.gov.pl/cps/rde/xbcr/lodz/ASSETS_12m_MAJOR_DATA.pdf
Population history
1810 514
1850 15.764
1872 100.000
1900 314.020
1939 672.000
1946 496.929
1988 854.003
2011 725.100
2030 605.104
http://pl.wikipedia.org/wiki/Ludno%C5%9B%C4%87_%C5%81odzi
Projected population loss by 2030 from today’s figures -15%
population loss by 2030, from the maximum in 1988 -29%
Polish migrants in Great Britain
2002 24.000 [1]
2007 695.000 [2]
2013 521.000 (offiziell registriert) [3]
thereof unemployed 14.000 (2,6%) [3]
[1] http://www.b-republik.de/archiv/polen-in-bewegung
[2] http://www.bpb.de/gesellschaft/migration/dossier-migration/146040/auswanderung-aus-polen-und-lettland
[3] http://www.infoseite-polen.de/newslog/?p=8981
Population (historical, by nationality)
Polish 1857 43% 1897 46,4% 1931 59%
German 1857 41% 1897 21,5% 1931 9%
Jews 1857 15% 1897 29,4% 1931 32%
Russians 1857 1% 1897 2,4% 1931 –
Inhabitants 1857 25,200 1897 321,000 1931 651,000
http://www.deutschlandundeuropa.de/46_47_03/Lodz_Stgt.pdf
Social stratification of the population of Lodz
(historical, results of the census from 1921)
Self-employed Jews 42,6% Poles 9,2% Germans 13,7%
Executives Jews 8,5% Poles 8,1% Germans 14,2%
White-collar, Jews 35,3% Poles 9,2% Germans 61,1%
Jewish Co-Workers, Family members 6,1%, Poles 1,2% Germans 2,5%
Unknown Jews 7,5% Poles 7,1% Germans 8,5%
http://edocs.ub.uni-frankfurt.de/volltexte/2008/38031/original/ZDSJ_31_01.pdf
ECONOMY
Gross Regional Product (2010) 33.912 billion zł = 7,9 billion EUR
GRP per Capita 45.838 zł = 10.721 EUR
http://www.stat.gov.pl/cps/rde/xbcr/lodz/ASSETS_12m__REGIONAL_ACCOUNTS.pdf
Company structure 2011
Registered companies 86.805
with 9 and fewer employees 82.054
over 1000 employees 27
http://www.stat.gov.pl/cps/rde/xbcr/lodz/ASSETS_12m_NATIONAL_ECONOMY_ENTITIES.pdf
LABOUR
Population of employable age 458,800
Employees total 225,6
thereof women 119,4
http://www.stat.gov.pl/cps/rde/xbcr/lodz/ASSETS_12m_MAJOR_DATA.pdf
Employment structure (selected fields)
Productive business 22,9%
Commerce and car repair 14,9%
Education 11,4%
Health and Social Service 9,3%
Public Administration 7,3%
http://www.stat.gov.pl/cps/rde/xbcr/lodz/ASSETS_12m_STRUKTURA_PRACUJACYCH.pdf
Unemployment rate (01 / 2004) ca. 20% [1]
Unemployment rate (2011) 11% [2]
[1] http://www.klasterlodzki.pl/pliki/wizyta_stud_20_09_05/Textile_September_20.pdf
[2] http://www.stat.gov.pl/cps/rde/xbcr/lodz/ASSETS_12m_MAJOR_DATA.pdf
Temporary contracts 27% (highest amount within the EU) [1]
with employees under 30 65% [1]
Low pay-sector ca. 25% [2]
Labour costs in Poland 7,20 EUR [3]
Labour costs in Germany 31,00 EUR [3]
New jobs since 1997 2 million [4]
Jobs lost since 1997 5 million [4]
Employment quota 1997 80% [4]
Employment quota 2012 52% [4]
[1] http://www.infoseite-polen.de/newslog/?p=6086
[2] http://epp.eurostat.ec.europa.eu/statistics_explained/index.php/Wages_and_labour_costs
[3] http://www.infoseite-polen.de/newslog/?p=8809
[4] http://www.monde-diplomatique.de/pm/2012/12/14.mondeText.artikel,a0042.idx,14
Working hours per week
average >45 h / w
<40 h / w 10%
40 h / w 41%
41-50 h / w 25%
51-60 h / w 10%
>60 h / w 12%
http://www.infoseite-polen.de/newslog/?p=7366
INCOME
Average monthly income
total 3427,06 zł = 801,95 EUR
Public sector 3929,45 zł = 919,11 EUR
Private sector 3099,77 zł = 724,91 EUR
lowest / Hotel- and restaurant industry 1849,92 zł = 432,39 EUR
highest / Financial services 5426,17 zł = 1.268,30 EUR
http://www.stat.gov.pl/cps/rde/xbcr/lodz/ASSETS_12m_ECONOMIC_ACTIVITY_WAGES_SALARIES_AND_SOCIAL_BENEFITS_WORK_CONDITIONS.pdf
Monthly minimum wage / per month in Euro
Poland 374
Hungary 341
Czech Republic 312
Bulgaria 159
Rumania 157
http://www.infoseite-polen.de/newslog/?p=8925
LIVING COSTS
Prices (in EUR)
12 eggs 1,61,-
1 kg tomatoes 1,04,-
bread for 2 persons (1 day) 0,54,-
0,5 l beer in a super market 0,66,-
1 l milch 0,59,-
Cleaning woman (1 hour) 3,40,-
Monthly rent for a 85 qm-flat
in an expensive neighbourhood 457,00,-
1 l petrol 1,32,-
Monthly ticket for public transpor 19,46,-
Cap ride (8 km) 6,15,-
http://www.expatistan.com
Working hours required for the purchase of…
1 Big Mac min. 36
1kg bread min. 13
1kg rice min. 24
1 iPhone 4S 16GB hrs. 141
http://www.ubs.com/global/en/wealth_management/wealth_management_research/prices_earnings.html
POVERTY
Poverty line 350 EUR
http://www.auslandsdienst.pl/3/21/Artykul/119944,Millionen-von-Polen-leben-in-Armut
Population below the poverty line 10,6%
https://www.cia.gov/library/publications//the-world-factbook/fields/2046.html
Minimum subsistence level
for a family of 4 1.336 zł = 315 EUR
for a single-person household 495 zł = 116 EUR
http://www.infoseite-polen.de/newslog/?p=7123
Population below the Minimum subsistence level (2011) 2,6 million
http://www.infoseite-polen.de/newslog/?p=7123
Minimum pension disability pension 177 Euro
http://www.monde-diplomatique.de/pm/2012/12/14.mondeText.artikel,a0042.idx,14
TRAFFIC
Registered cars 379.438
thereof
Motor cars 314.420
Busses 1.270Trucks 50.065
Motor bikes 7.115
http://www.stat.gov.pl/cps/rde/xbcr/lodz/ASSETS_12m_TRANSPORT_COMMUNICATION.pdf
Public Traffic
Streetcar lines 22
Bus lines 80
http://www.mpk.lodz.pl/showarticleslist.action?category=1172&Services+of+public+transport
SPECIAL ECONOMIC ZONE (SEZ)
SEZ in Poland 14
Surface area 15.000 ha
in 143 polish cities and 203 districts
Investment volume 20 billion EUR since 1995
Jobs 160.000
Corporations and enterprises often insist on becoming a part of a SEZ. Thus a SEZ is being established where enterprises wish it to be.
http://www.gegenblende.de/++co++c68d215a-185c-11e2-906d-52540066f352
SEZ Lodz
Publicly funded portion the highest in Europe
up to 70% of the investment costs
no income tax
Possibility of release from real estate taxes
Trade permissions over 200
Investment volume over 2 billion EUR
Jobs ca. 25.000
Surface area 1.276 ha
http://www.sse.lodz.pl/images/stories/inne/Die%20SONDERWIRTSCHAFTZONE%20LODZ%20-%20folder.pdf
Educational Centre Lodz
The number of students choosing Lodz as a suitable place to study is increasing every year. Hence, schools and scientific institutions located in the voivodeship fully satisfy the demand for qualified employees in the entire region.
http://www.sse.lodz.pl/index.php?option=com_content&view=article&id=131&Itemid=140&lang=en
Universities in Lodz over 20
State operated 6
Students 135.000 (voivodeship)
thereof
IT 9000
Engineering science 6.500
Economy / Administration 34.000
English 3.289
http://www.sse.lodz.pl/index.php?option=com_content&view=article&id=131&Itemid=140&lang=en
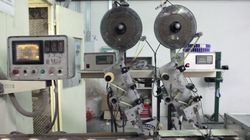
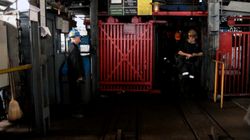
TEXTILE INDUSTRY
Already in the 1860s Lodz was a big textile centre, responsible for 24 percent of the kingdom of Poland’s production. At the end of the 19th. century, 20 stock corporations were responsible for 70 percent of Poland’s textile production. Of the 20 biggest cotton factories with over 1000 workers, 17 were located in Lodz.
http://www.deutschlandundeuropa.de/46_47_03/Lodz_Stgt.pdf
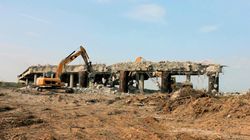
After 1989, the textile industry in Lodz collapsed and was replaced by more modern and mechanized industries, such as household equipment or, later, computer manufacturing. This resulted in a decreased number of people employed in industry.
http://www.fns.uniba.sk/fileadmin/user_upload/editors/geog/kfg/AGUC/Archivy/55-1/55_1_01_Cudny_Rouba.pdf
Light industry 1989 (mostly textiles-, garments- and shoes or leatherwear)
Employed in the light industry
Percentage of all the employees in Poland 15,1 Lodz 55,2
Exports of light industry products
Percentage of all the exports in Poland 5,5 Lodz 13,7
http://www.eu-newgov.org/database/DELIV/D23D05_Research_report_case3-Poland.pdf
Unemployment after the end of communism in Poland
1989 Full employment
1991 50.000
1992 83.000
1993 85.000
http://www.eu-newgov.org/database/DELIV/D23D05_Research_report_case3-Poland.pdf
Employees in the textile industry
1985 92.296
1990 70.830
1998 49.600
2004 27.800
Łódź textiles in the new Polish economic order; Stanislaw Paczka and Raymond Riley; Geography Vol. 77, No. 4 (October 1992), pp. 361-363.
http://www.klasterlodzki.pl/pliki/wizyta_stud_20_09_05/Textile_September_20.pdf
Women in the textile industry
In the postwar years roughly 63 percent of the inhabitants of Łódź, were employed in industry. Women made up 54 percent of all these industrial workers, and even higher percentages in specific branches: 58.5% in the textile industry, 66.5% in the paper industry, and 82.9 percent in the clothing industry. In the Poznański cotton mill, for example, in 1953 of 9,142 employees, 5,417 (59%) were women. By 1970, 755 thousand people lived in Łódź, of which 405 thousand (54%) were women. Women made up exactly 50 percent of the workforce, the highest rate in the country, with 87 percent of women of working age in active employment. In light industry, 89,000 of 133,000 workers (67%) were women.
http://www.academia.edu/544115/Promised_Land_Red_Lodz_or_HollyLodz_Shifting_Identities_in_an_Industrial_City._1820-2010
MODIFICATION OF THE INDUSTRIAL HERITAGE
Manufaktura – former textile factory of Izrael Poznanskis;
former textile factory Poltex with 12.000 employees
One of the biggest shopping malls in Europe, in a historical textile factory with over 300 shops, 3 museums a casino, a multiplex cinema, and 51 restaurants, cafés and bars.
Surface area 27 hectares
renovated area 90.000 qm
development area 95.000 qm
Investment volume 200 billion EUR
Places of work 4.200
Business area 150.000 qm
thereof
retail sector 100.000 qm
Leiasure areas 21.000 qm
Hotel and office areas 20.000 qm
Culture 8.000 qm
http://www.ehi.org/fileadmin/images/content_images/Verlag/stores+shops/2006-04/s+s406_Leseprobe.pdf
CITY OF FESTIVALS
Festivals in Lodz annually ca. 50
Transformations in Poland after 1989 led to many changes in the economic and social structure of the city. The transformation resulted in intensive de-industrialization and development of services but also to an intense demographic and social crisis. At the same time, new cultural and entertainment events, especially festivals, started to develop in the city. At present, these are among the best developed areas of urban culture.
http://www.sav.sk/journals/uploads/011012462012%20Cundy%20-%20OK.pdf
Theater festivals for example
International Festival of Street Art – Trotuart; New European Classics – Theatre Festival of World Classics; Lodz Ballet Meetings – International Festival of Ballet Art; International Festival of Solo Puppeteers; Polish Festival of Plesant and Unpleasant Arts
Film festivals for example
The ‘Large Format’ Film Makers Festival; The ReAnimation Festival; Dance Cinema Festival; The International Festival of Film and Television Schools
Other festivals for example
International Festival of Photography; International Festival of the Comic Book and Games; Łódź Biennale; Summer Art Festival; Magicians’ Congress; Four Cultures’ Dialogue Festival; Łódź Design Festival
Number of hotel guests in Lodz
2000 ca. 150.000
2005 ca. 190.000
2009 ca. 250.000
http://www.fns.uniba.sk/fileadmin/user_upload/editors/geog/kfg/AGUC/Archivy/55-1/55_1_01_Cudny_Rouba.pdf