
Boston|U.S.A.
Statistical Data
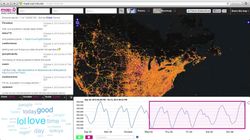
Google entries for Boston 507,000,000
Google entries per inhabitant (city) 811.08
Founding 1630
http://en.wikipedia.org/wiki/History_of_Boston#Founding
Population (2012)
City 625,087
Metro 4.59 million
http://en.wikipedia.org/wiki/Boston
Population History (city)
1950 801,444
1960 697,197
1970 641,071
1980 562,994
1990 574,283
2000 589,141
2010 617,594
2012 625,087
http://en.wikipedia.org/wiki/Boston
Area
City 89.63 sq mi (232.14 km2)
Land 48.43 sq mi (125.43 km2)
Metropolitan area 4,511 sq mi (11,683 km2)
http://en.wikipedia.org/wiki/Boston
Density (inhabitants / sq mi / km2)
City 12,907/ sq mi (4,983.5/ km2)
http://en.wikipedia.org/wiki/Boston
CLIMATE DATA
Average high temperature 59.18° F (15.1° C)
Average low temperature 43.70° F (6.50° C)
Rainfall / year 41.5 inches (1054.3 mm)
Days of rain / year 98.7
http://de.wikipedia.org/wiki/Boston
POPULATION
Ethnic composition (2010)
White (non-Hispanic) 47%
Thereof
Of Irish descent 15.8%
Of Italian descent 8.3%
Black or African-American 24.4%
Hispanic or Latino 17.5%
Asian 8.9%
Two or more races 3.9%
Native American 0.4%
http://quickfacts.census.gov/qfd/states/25/2507000.html
ECONOMY
GDP (metropolitan area, 2012) 320.7 billion U.S. dollars [1]
GDP per capita (metropolitan area, 2012) 69,308 U.S. dollars [1]
Share of the national GDP 2.04% [2]
Percentage of US population 47% [2]
[1] http://www.brookings.edu/research/interactives/global-metro-monitor-3
[2] http://www.brookings.edu/~/media/Multimedia/Interactives/2013/tentraits/Boston.pdf
Since 2002, the city of Boston has been ranked number 1 in the world in science and technology and number 4 in patent applications. The city’s specialization in sectors such as computers and electronics, business services, chemicals, and royalties enabled it to increase its exports by 12 percent between 2009 and 2010 and to climb from 83rd to 25th place in the ranking of top exporting U.S. cities. Since 2009, Boston’s economy has grown at a rate of 4.8 percent, the highest among all major U.S. metropolitan areas. Though approximately 10 percent of the population of Massachusetts lives in Boston, the city is home to 18 percent of all jobs in the state. In 2011, Boston was ranked the most innovative city in the world, as the U.S. city with the best Internet connectivity, and as the third best U.S. city in terms of quality of life, after Honolulu and San Francisco.
http://www.brookings.edu/~/media/Multimedia/Interactives/2013/tentraits/Boston.pdf
Largest employers divided by field (range, city, 2011)
Total jobs 674,919
Thereof
Hospitals 85,928
Finance and Insurance 79,513
Professional, Scientific, and Technical Services 77,639
Government 77,468
Accommodation and Food Services 53,702
Colleges and Universities 46,705
Retail Trade 31,092
compared to
Manufacturing 9,372
http://www.bostonredevelopmentauthority.org/PDF/ResearchPublications/Economy%20Report%202013-FINAL.pdf
Average hourly rates for selected occupations in USD (2012)
Total, all occupations 28.05
Lawyers 65.63
General and operations managers 63.26
Management analysts 50.48
Software developers, applications 49.61
Registered nurses 40.88
Construction laborers 24.15
Production laborers 18.94
Office clerks, general 16.57
Waiters and waitresses 13.17
Retail salespersons 12.79
Cashiers 10.36
Cooks, fast food 10.17
http://www.bls.gov/ro1/blssummary_boston.pdf
Unemployment rate in percent (July 2013)
Boston (metropolitan area) 6.6
Boston (city) 7.6
US 7.7
http://www.bls.gov/ro1/blssummary_boston.pdf
Foreclosures on single-family homes in Greater Boston
2003 25
2005 180
2007 2,061
2008 3,055
2010 3,015
2011 2,146
http://www.northeastern.edu/dukakiscenter/wp-content/uploads/2012_Housing_Report_Card.pdf
Minimum Wage
Minimum wage (2013) $8 [1]
Annual salary based on minimum wage $16,640 [1]
Workers at or below minimum wage (Mass. 2012) 62,000 [2]
Thereof below minimum wage 45,000 [2]
[1] http://www.wbur.org/2013/03/20/two-bed-apartment-minimum-wage
[2] http://www.bls.gov/ro1/minwage.htm
Low-wage jobs are fast replacing middle-class ones in the U.S. economy. Sixty percent of the jobs lost in the last recession were middle-income, while 59 percent of the new positions during the past two years of recovery were in low-wage industries that continue to expand such as retail, food services, cleaning and health-care support. By 2020, 48 percent of jobs will be in those service sectors.
http://www.bloomberg.com/news/2013-06-19/the-capitalist-s-case-for-a-15-minimum-wage.html
Declining value of the minimum wage since 1968 25%
The minimum wage would need to rise compared to
Inflation since 1968 to $10.72
wages of the 90th percentile since 1979 to $13.67
Worker productivity since 1979 to $19.77
http://www.massbudget.org/report_window.php?loc=labor_day_2013.html
Income Inequality
the top 5% of earners accounted for 25% of total annual income
the bottom 20% earned 2,2% of the total annual income
more than one-third of families of color had annual incomes of less than $ 25,000
10% of families of color had incomes of less than $ 10,000 per year
almost half of the white families had annual incomes of $ 100,000 or more
10% of white families had incomes of less than 25,000 per year
http://www.tbf.org/~/media/TBFOrg/Files/Reports/Final%20Poverty%20report.pdf
Boston’s recent economic dynamism reflects an increase in wealthy, well-educated residents rather than a decline in poverty, with widening inequality and stark racial/ethnic disparities.
http://www.tbf.org/~/media/TBFOrg/Files/Reports/Final%20Poverty%20report.pdf
Union Membership (Massachusetts, 2012)
Members 410,000
Percentage of all workers 14.4%
http://www.bls.gov/ro1/mactum.htm
Low-wage employment
How high does the hourly rate for low-wage workers need to be, based on different standards (2012, calculated for a family of 4 with two adults working full-time)
Federal Poverty Level $10.6
Social Inclusion $14.94
(Defined as two-thirds of the median hourly wage)
Family Economic Self-Sufficiency Standard $ 16.15
(Defined as the income required to meet basic needs without public subsidies)
http://works.bepress.com/cgi/viewcontent.cgi?article=1010&context=susan_moir
Low-wage earners in Boston
(Metropolitan area, according to the Family Economic Self-Sufficiency Standard, 2005-2009)
Total 798,496
Percentage of all workers 41%
Thereof
In the private sector 633,623
In the public sector 73,591
Self-employed 77,767
http://works.bepress.com/cgi/viewcontent.cgi?article=1010&context=susan_moir
Distribution of low-wage earners by industry
Accommodation & Food services 76%
Retail Trade 62%
Educational Services 43%
Manufacturing 28%
Construction 37%
Art, Entertainment & Recreation 71%
Finance & Insurance 19%
Public Administration 21%
http://works.bepress.com/cgi/viewcontent.cgi?article=1010&context=susan_moir
BUDGET SEQUESTRATION (Sequestration = automatic spending cuts
in particular categories of federal outlays according to the Budget Control Act of 2011
In effect since March 2013 [1]
Total (US) $1.1 trillion until 2021 [1]
Total US 2013 (fiscal year to Sept. 30, 2013) $ 85 billion [2]
[1] http://en.wikipedia.org/wiki/Budget_sequestration_in_2013
[2] http://www.huffingtonpost.com/2013/03/01/obama-sequester-order_n_2793653.html
We’re not only the Bay State, we’re the Brain State, and that did not happen by chance,” (Senator Ed) Markey said in an interview. “It’s in large part due to federal funding that supports our leading researchers and scientists and innovative bio-tech companies, and federal funding that supports our education programs, and the billions of dollars our hospitals receive to train the next generation of doctors. The massive arbitrary cuts threaten Massachusetts’ role as the nation’s high tech, bio-tech, clean tech hub.
http://www.boston.com/politicalintelligence/2013/02/15/massachusetts-will-lose-jobs-congress-enacts-sequestration-report-says/zcJBA7HgAGE7rbr8KU6xUI/story.html
Impact of sequestration on teachers and schools in Massachusetts 2013
Decrease in funding for primary and secondary education 13.9 million Jobs at risk among teachers and aides 190
Decrease in funding for education for children with disabilities $13.4 million
Jobs at risk among staff for education for children with disabilities 160
http://www.washingtonpost.com/wp-srv/special/politics/sequestration-state-impact
Impact of sequestration on federal housing assistance and community development programs in Massachusetts 3013 for low-income households in 2013
Funding reduction for housing and community development programs approx. 5% (- $5,745,593)
Funding reduction for Housing Choice Vouchers approx. 5% (- 3.847 affected families)
Funding reduction for public housing minus approx. 5% (- $9,551,642)
Funding reduction for homeless assistance approx. 5% (- $3,584,945)
Funding reduction for HIV / AIDS housing approx. 5% (- $206,084)
http://www.cbpp.org/files/1-28-13hous.pdf
Impact of sequestration on the HomeBASE-program, the Metropolitan Boston Housing Partnership (MBHP)
Yearly spending budget of HomeBASE $19 million
Number of families in the program in Boston (city) 1,030 (Massachusetts 5,000 families)
Annual income average of participating families $10,140
Annual income necessary to afford a two-bedroom apartment at fair market rent in Boston $49,512
Rental price higher than the income 85% of families
more than half of the families will lose rental assistance on or before December 2013
all families will lose rental assistance on or before June 2014
http://www.mbhp.org/HomeBASE%20Report_Final.pdf
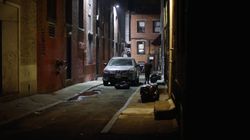
There are a huge number of families, about 200,000 in Massachusetts, with income so low they qualify for emergency assistance. Families with income of $18,000 for a family of three qualify for emergency assistance. [...] 90,000 families have housing vouchers, either section 8 or Massachusetts Rental Voucher Program (5900 families). Housing is very expensive in Massachusetts. Apartment rent would require 85% of income in greater Boston for a family at the EA limit, and 65% of income outside greater Boston. [...] The number of homeless families in motels has nearly tripled in the last four years, increasing from 600 to nearly 1700 in December 2012.
http://www.endfamilyhomelessness.net/statistics
POVERTY
Federal Poverty Line (FPL, 2013)
Single Person $ 11,490.00/annually
Family of 4 $ 23,550/annually
http://www.medicaid.gov/Medicaid-CHIP-Program-Information/By-Topics/Eligibility/Downloads/2013-Federal-Poverty-level-charts.pdf
Bostonians below the poverty line (2005-2005)
All residents 19%
Families with children 23%
All children 28%
Latino children 40%
African American children 35%
Asian children 31%
White children 9.5%
http://forwardwithfelix.com/wp-content/uploads/2013/09/Pathways-out-of-Poverty.pdf
Households with income below the poverty line (city, 2010) 21.2%
Children below the poverty line (city, 2010) 30.5%
http://www.bostonredevelopmentauthority.org/PDF/ResearchPublications//2012%20Boston%20by%20the%20Numbers-%20Children.pdf
COST OF LIVING
Prices in Euro
12 eggs € 2.91
1 kg (2 lb.) tomatoes € 1.86
bread for 2 people for 1 day € 2.13
0.5 l (16 oz.) beer in the supermarket € 1.82
1 liter (1 qt.) of whole fat milk € 0.72
hourly rate for cleaning help € 35
monthly rent for a 85 m2 (900 sqft) apartment
in an expensive area of the city € 1,956
1 liter (1/4 gallon) of gas € 1.90
monthly ticket public transport € 54
http://www.expatistan.com
Monthly cost of living for a family of 4 (metropolitan area, in US-dollar 2013)
Housing $1,444
Food $754
Child care $1,505
Transportation $607
Health care $1,585
Other $563
Taxes $751
Monthly total $7,209
Annual total $86,502
http://www.epi.org/resources/budget
It takes more income for a family to be self-sufficient in Massachusetts than almost anywhere else. Factoring in the costs of day care, housing, utilities, and food, the Crittenton Women’s Union estimates that a mother with two young children would need $65,880 to meet basic expenses without relying on any state subsidies. That’s an eye-popping $31.55 an hour.
http://www.bostonglobe.com/opinion/2013/06/17/what-wage-worth/DPJQRnv6skJw7k7nRMOGmJ/story.html
Average asking rent for new rentals for apartments (2 bedrooms) (12 / 2011) in different neighborhoods
East Boston $1,689
Cambridge $2,462
Seaport $3,144
Average $2,126
http://static.rentjuice.com/rj_index/BostonIndex-4Q2011.pdf
Rent prices in Greater Boston (2010)
More than 50% of renters spend more than 30% of their income on rent
25% of renters spend more than 50% of their income on rent
http://www.northeastern.edu/dukakiscenter/wp-content/uploads/2012_Housing_Report_Card.pdf
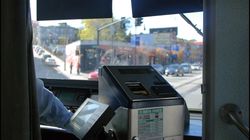
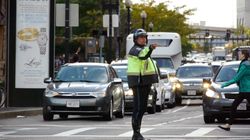
TRAFFIC
Public transportation, Massachusetts Bay Transportation Authority (MBTA)
The MBTA is the nation's 5th largest mass transit system and serves a population of 4.8 million. It maintains 13 commuter rail routes, 3 subway lines, 5 light rail routes, 4 trackless trolley lines, and 183 bus routes, two of which are Bus Rapid Transit lines. [1]
Commuters served in 2012 404,788,328 [2]
Commuters on a typical day 1,311,149 [2]
[1] http://www.mbta.com/about_the_mbta/history/default.asp?id=970
[2] http://www.mbta.com/uploadedfiles/About_the_T/Financials/14-18%20Final%20CIP.pdf
Modal split (2009)
Private motor vehicle 45%
Public transport 35%
Walking 14%
Cycling 2%
http://www.rad-spannerei.de/blog/2013/01/28/modal-split-in-millionenstaedten
Boston reduces the requirements for developers to create parking spaces when building: "The facts are that the young people who are the surge of the population growth in the city have fewer cars — interestingly, fewer licenses as well. And they care deeply about their carbon footprint. And so a lot of them instinctively are doing something that people in my generation didn’t do, and that is they don’t have a car and they feel no need for a car. Or they rent a car when they need it, and they take public transportation, walk or bike to work.“ (Peter Meade, Director, Boston Redevelopment Authority)
http://www.wbur.org/2013/07/05/bra-parking-spaces